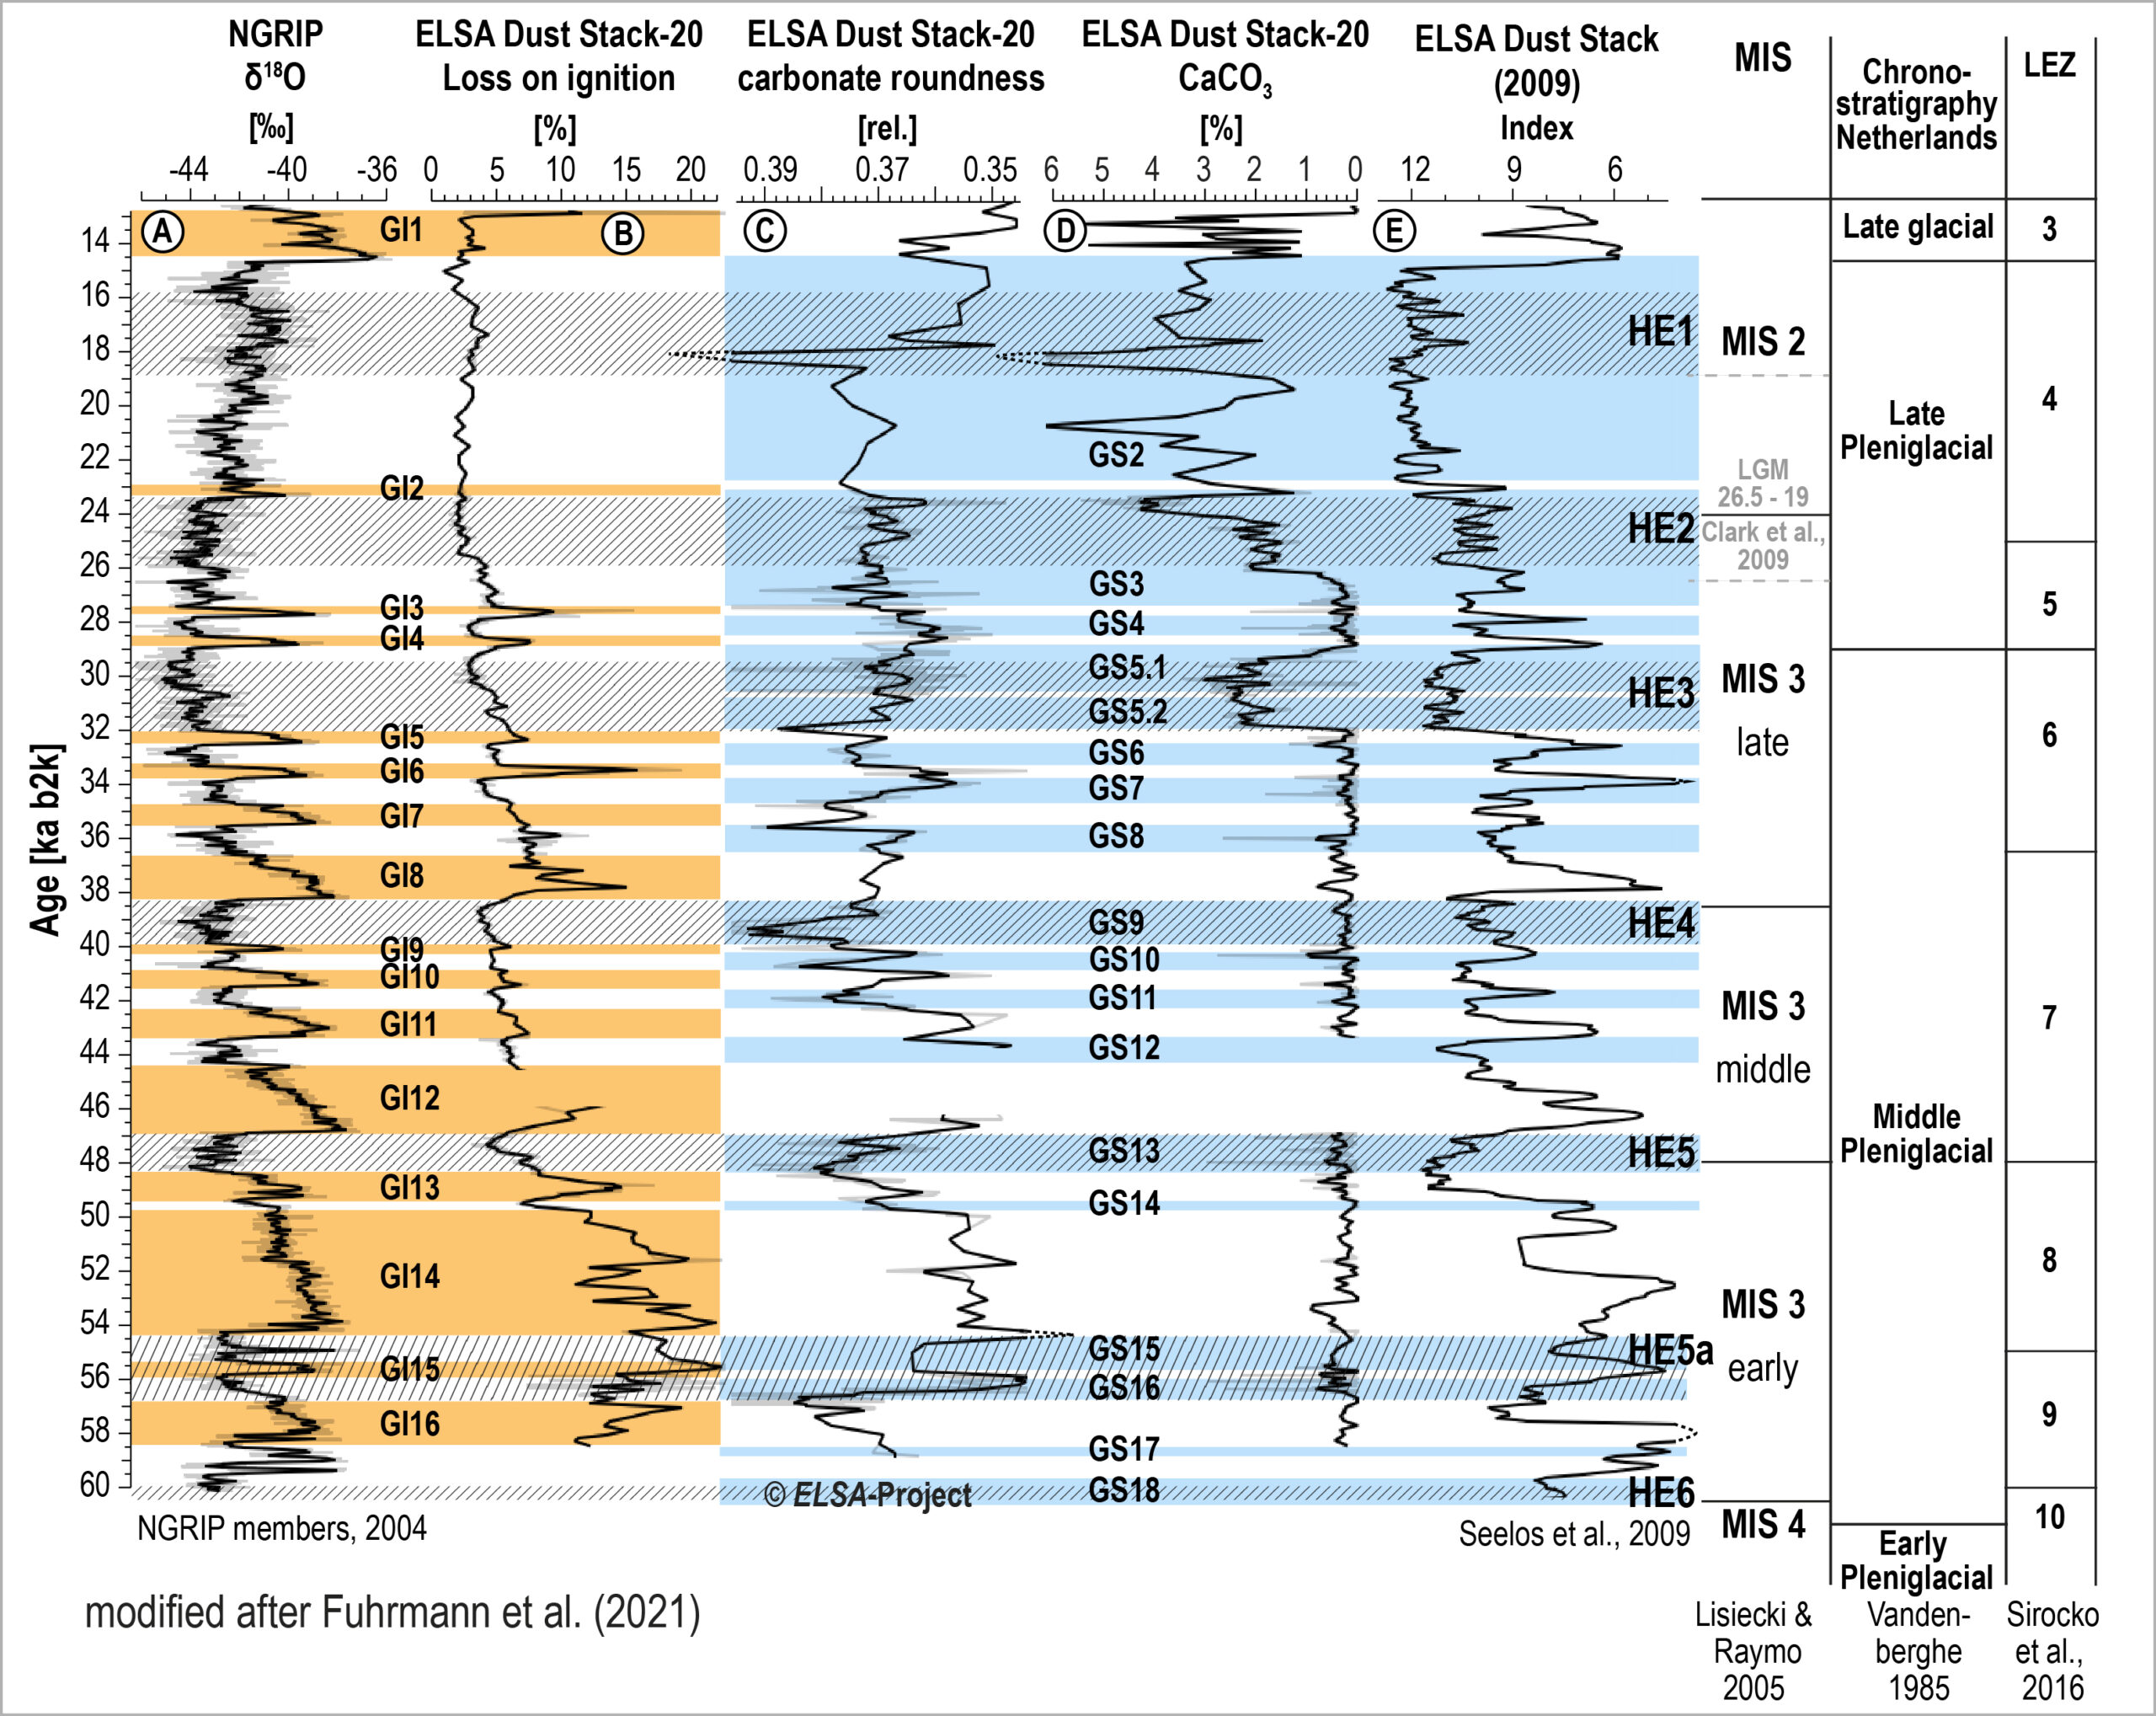
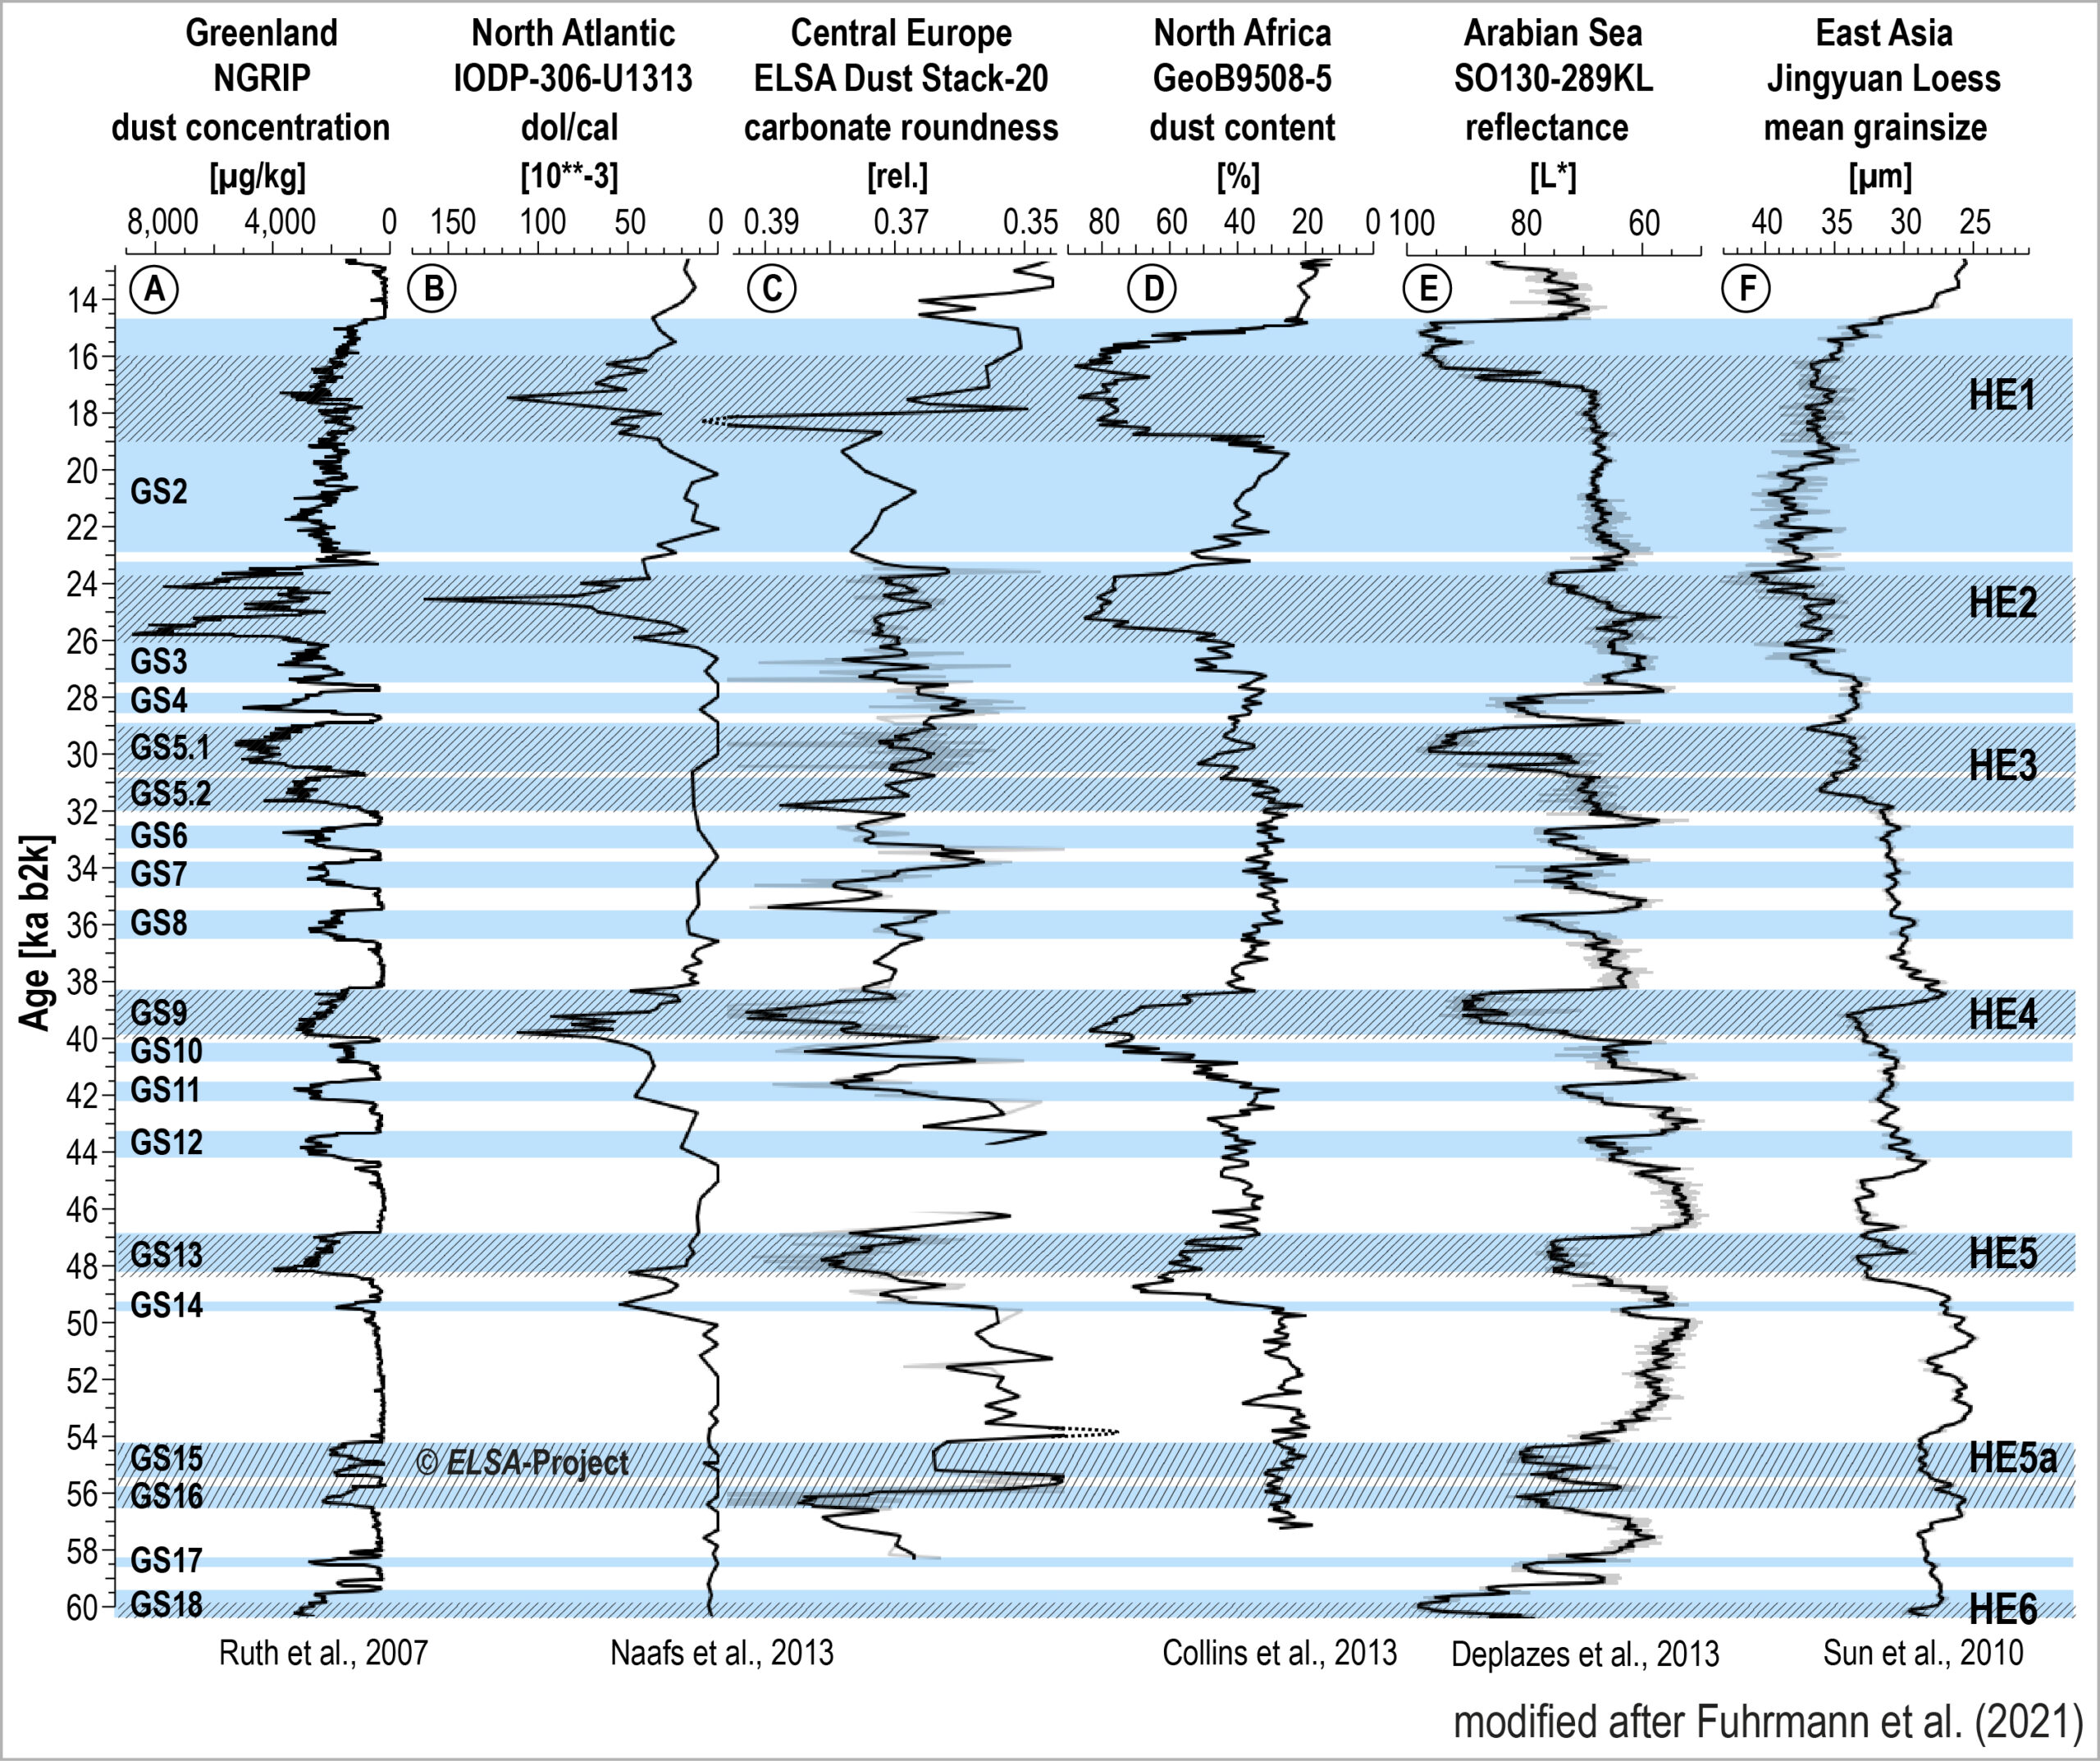
Annual resolution grain analysis, the ELSA-Dust-Stack
- Figure Dust Grains
- Graphic (1) Eolian Dust
- Graphic (2) Eolian Dust
10 cm segments of the sediment are taken from the core and impregnated with a resin to harden the sediment. The resin impregnated blocks are cut and grinded to 30 µm thickness of a petrographic thin section. Quartz particles are detected under a scanning microscope and the grain size of quartz determined by the RADIUS software developed by Klemens Seelos (Seelos & Sirocko, 2007). The scanned thin section is analyzed in 1 mm increments to determine the grain size distribution of the quartz fraction with mm resolution. Sorting parameters are then used to quantify the eolian quartz fraction (Seelos et al., 2009). Besides aeolian dust particles we find proportions of silt grains from wave induced erosion and riverine suspension contributions. These three components of the silt fraction will be seperated in an upcomming project to arrive finally at an update of the ELSA-Dust-Stack.

First results on µXRF geochemical analysis were presented by Dietrich & Seelos (2010) to reconstruct wind directions during the LGM. The presence of Ca-rich eolian grains was used by these authors to determine the glacial dust fraction transported by winds from the East. This approach worked only for the sediments from Dehner Maar, because this maar is westward from the Eifel carbonate rock regions. Fuhrmann et al. (2021) adapted this approach for the carbonate rock fraction deposited in Auel.